
50 new cafés could put a Plato within 10 km of 14 million more South Africans
We love Plato so much that we wondered where we would open one ourselves. So we asked our store location model where the next 50 Plato cafés should go to bring the most people within reach.
We at meado love a Plato coffee as much as the rest of South Africa, if not more. Not even the fancy new coffee machine in our office has slowed the stream of Plato cups through the door. It has got to the point where we’ve half-seriously considered opening a Plato of our own, which made us wonder where the best new locations would be.
Luckily, we already had the tool for the job. Our new store location model places new sites to reach as much as possible of whatever it’s asked to cover, whether that’s people, household income or any other measure. We ran it both ways. Plato isn’t only about the money. It’s about the community around each café, so our main plan weights every neighbourhood by its population, to reach as many new customers as possible. For readers more interested in the business side, we also ran the same model weighted by household income.
The Challenge
Plato has 163 cafés, most of them in Cape Town and in Johannesburg and Pretoria. Across the nine metros we studied, 47.8% of people live within 10 km of one today. In eThekwini, Mangaung and Nelson Mandela Bay, it is about one in four or fewer.
There are 1,543 candidate sites in those metros. Picking the best 50 is harder than ranking them one by one:
- Sites overlap. Two good sites 5 km apart serve mostly the same people. Whether a site is worth opening depends on what’s already around it, including Plato’s own cafés.
- People aren’t spread evenly. A dense neighbourhood can hold more people than a whole suburb. The plan has to count them neighbourhood by neighbourhood, not city by city.
- Order matters. 50 cafés won’t open on the same day, so the plan should say which to open first, so that the earliest openings reach the most people.
Our Solution
The model divides the nine metros into 40,585 neighbourhood cells, each with its population and mean household income. A cell counts as reached when a café is within 10 km of it. Cells already within reach of Plato’s 163 cafés are counted first, so a new café only gets credit for people that no existing café already serves.
The model then builds the network one café at a time. At each step it picks the candidate site that reaches the most new people, adds that site’s reach to the network and recalculates every other candidate. Fifty steps give both the 50 sites and the order to open them in, and a full run takes 65 seconds.
The only thing that changes between our two plans is the weighting field: the number attached to each neighbourhood that the model tries to cover. Here it is population. It could equally be household income, or any other measure a business cares about, such as foot traffic, commuter flows, student numbers or the distance to a competitor. The list of candidate sites is an input too, so the model can choose from real places to open (see section 04).
The Results
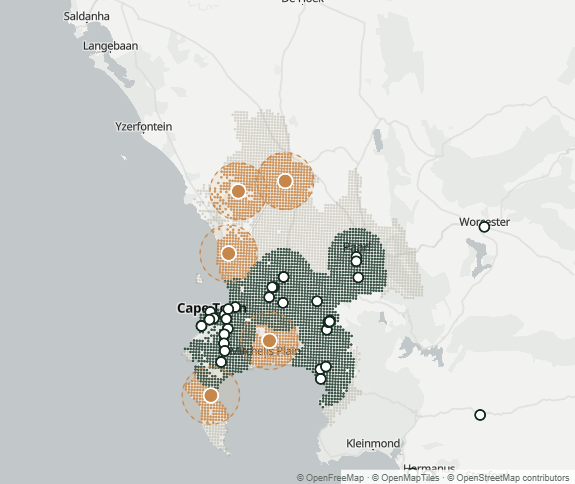
With the 50 new cafés open, 96.4% of people in the nine metros would live within 10 km of a Plato, double today’s 47.8%. That is 14.1 million more people, in 3.97 million households.
| Today | With 50 new | Change | |
|---|---|---|---|
| Cafés in the network | 163 | 213 | +50 |
| People within 10 km of a café | 47.8% | 96.4% | +48.7 pts |
| People newly within reach | – | 14.1 m | new |
| Households newly within reach | – | 3.97 m | new |
Where the new cafés go
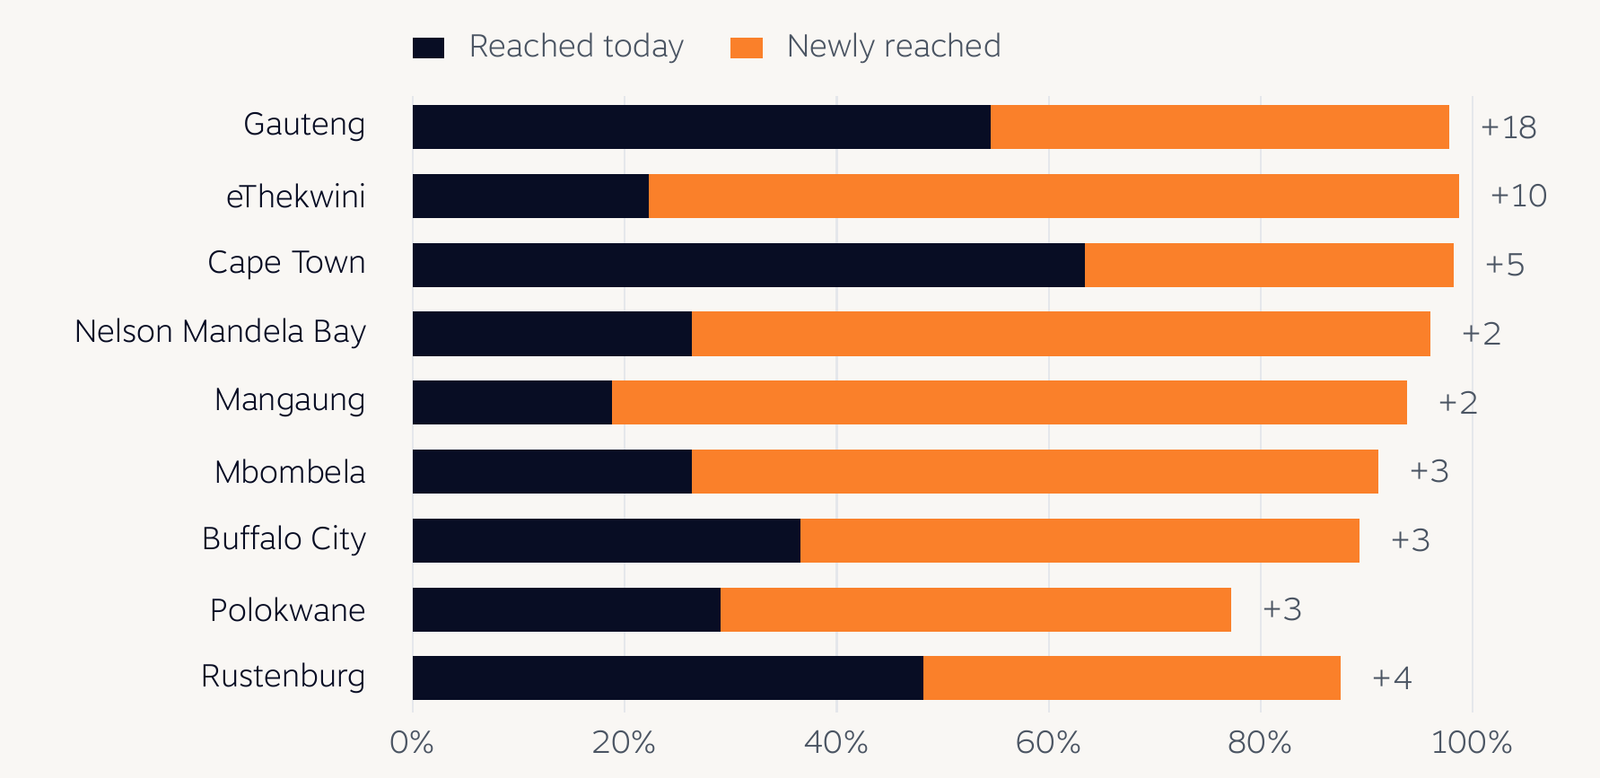
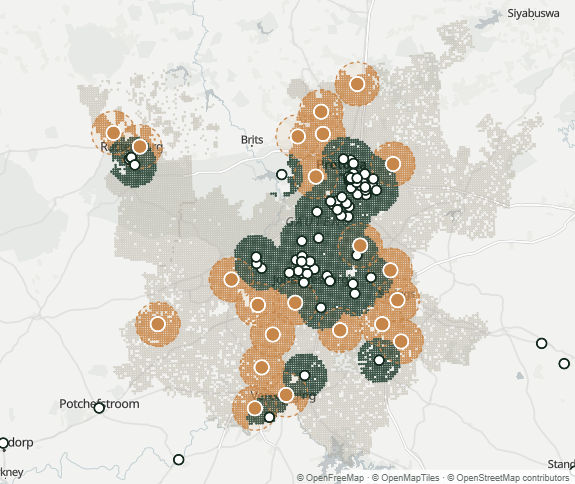
Gauteng gets 18 of the 50 cafés and eThekwini gets 10. The biggest changes are outside Plato’s home metros. In eThekwini, the share of people within reach goes from about a fifth to almost everyone. Mangaung and Nelson Mandela Bay go from about a fifth or a quarter to more than nine in ten. Every metro ends up with more than three-quarters of its people within reach.
Open in order
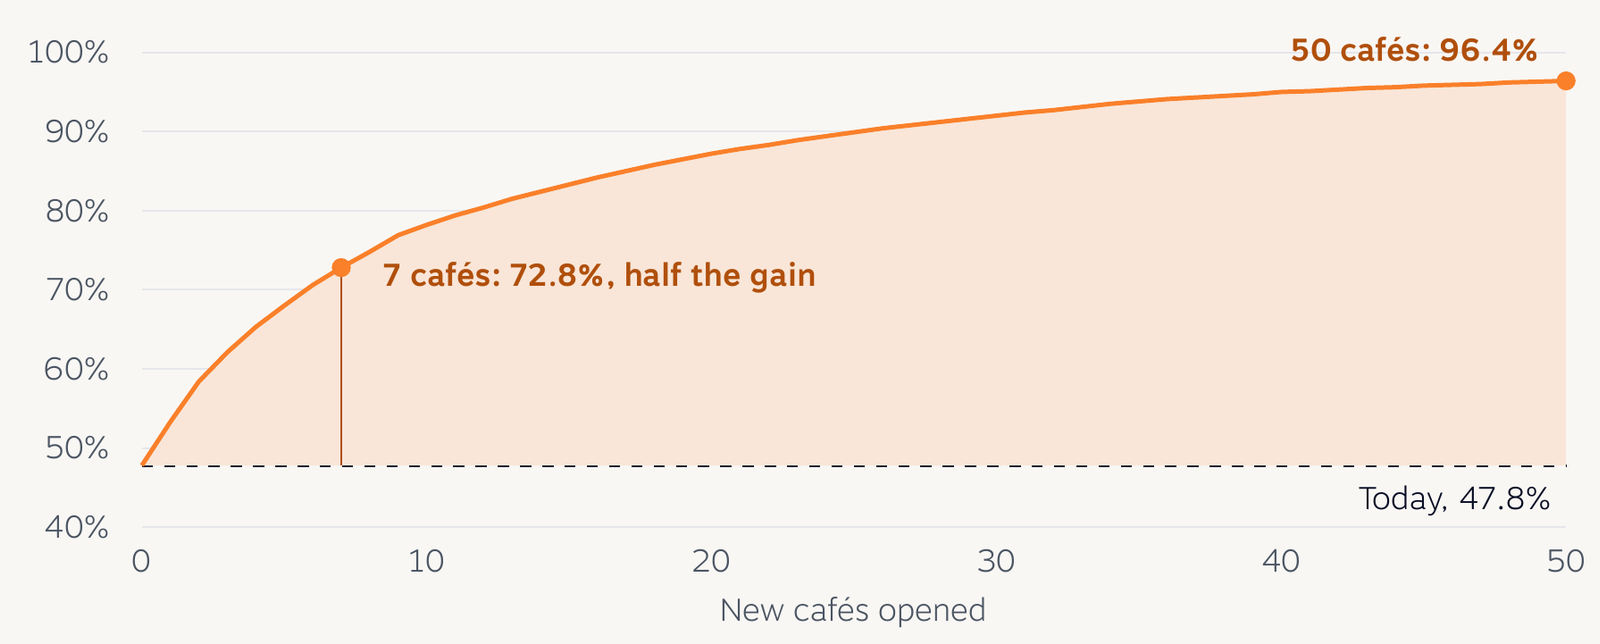
The sites are ranked by how many new people each one reaches, so the first openings do the most work. The first three cafés, in Gauteng, Cape Town and eThekwini, each reach more than a million new people. The first seven deliver half of the total gain, and after the 41st café, more than 95% of people are within reach. The last openings fill smaller, scattered gaps.
All but one of the 50 sites are more than 10 km from an existing café, and half are more than 19 km away. The new cafés would reach new communities rather than compete with Plato’s own cafés for the same customers.
Real Places to Open
A good spot on a map isn’t always somewhere you can open a café. So we ran the population-weighted model again, this time choosing only from real retail locations. We took them from OpenStreetMap, the free map edited by volunteers: 1,954 places, made up of 965 shopping centres and malls, 884 retail areas such as strip malls and shopping streets, and 105 markets.
Restricted to these places, the plan keeps 95% of the gain. 94.1% of people in the nine metros would live within 10 km of a Plato, against 96.4% in the main plan, and 13.4 million more people would be within reach. The two plans follow the same pattern: 42 of the 50 real sites are within 10 km of a site in the main plan, and half are within 6 km. Using real candidates moves each pick to the nearest real shopping centre or high street, with little loss of reach.
| Any site | Real retail sites | |
|---|---|---|
| Candidate sites | 1,543 | 1,954 |
| People within 10 km after opening | 96.4% | 94.1% |
| People newly within reach | 14.1 m | 13.4 m |
| Cafés that deliver half the gain | 7 | 8 |
The candidate list can be anything a business already has: a landlord’s vacancy schedule, a franchise pipeline or a property team’s shortlist. Each candidate can also carry a fixed cost, such as rent and fit-out, so the model weighs reach against cost (we left costs blank here). The OpenStreetMap places are plausible spots for a café, not confirmed vacancies.
The Business Case
For readers who think in rand rather than in people, we ran the same model with one change: each neighbourhood was weighted by its mean household income instead of its population. Weighted that way, the model favours neighbourhoods with higher incomes, so each café reaches fewer people.
Any site: two different networks
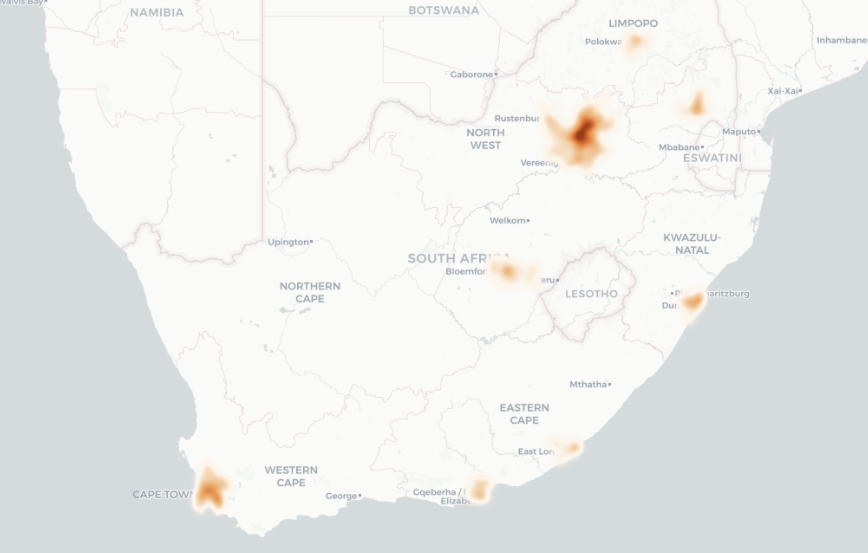
With a free choice of sites, the income-weighted plan takes the share of household income within 10 km of a Plato from 39.2% to 68.4%. To get there it often picks sites on the edge of affluent suburbs. The second site on its list reaches 19,000 people, while the top population sites each reach more than a million. In total it brings 6.25 million people within reach, less than half of the population plan’s 14.1 million. Only three sites are identical in the two plans, although 20 of the population plan’s sites lie within 10 km of a site in the income plan.
Real sites: the two plans converge
Then we gave the income-weighted model the same 1,954 real retail locations. The share of household income within reach rises from 39.2% to 60.8%, which keeps 74% of the income gain from the free-choice plan. The share of people within reach jumps from 69% to 91%, and 12.7 million people are newly within reach, twice as many as before. Shopping centres and high streets are where people already are, so even an income-weighted pick lands near a lot of customers.
The two real-site plans also have a lot in common. 25 of the 50 sites are identical in the population plan and the income plan.
| By people Any site | By people Real sites | By income Any site | By income Real sites | |
|---|---|---|---|---|
| Candidate sites | 1,543 | 1,954 | 1,543 | 1,954 |
| People within 10 km | 96.4% | 94.1% | 69% | 91% |
| People newly within reach | 14.1 m | 13.4 m | 6.25 m | 12.7 m |
| Household income within 10 km | – | – | 68.4% | 60.8% |
| Cafés that deliver half the gain | 7 | 8 | 20 | 17 |
What this means for a rollout
- Start with the shared core. The 25 sites that both real-site plans pick are strong on people and on spending power. They are the obvious first openings, whatever the final weighting.
- Income alone is a narrower bet. Chasing income on a free choice of sites gives the highest income share, but reaches fewer than half as many people. Real candidates give most of the income gain while keeping the community reach.
- Income gains build more slowly. The income plans need 17 to 20 cafés to deliver half their gain, against 7 or 8 for the population plans. A rollout weighted by income should budget for a longer ramp-up.
- Add costs to rank by return. With rent and fit-out entered for each candidate, the model can weigh the reach of every site against what it costs to open.
Neither weighting is the right one. They answer different questions, and the same model can answer others too: a blend of people and income, foot traffic, or any other metric a business wants to cover.
Conclusion
Fifty well-placed cafés would grow Plato’s network by less than a third, from 163 to 213, and double the share of people who live near one. Four findings stand out:
- Seven cafés do half the work. The first seven sites alone bring 7.2 million more people within reach, so a phased rollout pays off early.
- The growth is beyond the home metros. 27 of the 50 sites are outside Gauteng and Cape Town, ten of them in eThekwini.
- Real sites cost little reach. Choosing only from real shopping centres, retail areas and markets keeps 95% of the gain.
- What you weight is what you get. Weighting by people or by income gives different networks, but on real sites half of the picks are the same. Those 25 sites are a strong place to start.
We haven’t opened our own Plato just yet. If Plato or any other business ever wants a ranked list of sites, with coordinates and the people each one reaches, we know where we’d start.
Data and credits. Population and household income: J. W. Joubert (2022), Synthetic populations of South African urban areas, Mendeley Data, V3, doi:10.17632/dh4gcm7ckb.3, licensed under CC BY 4.0. Candidate retail locations and map data © OpenStreetMap contributors, © OpenMapTiles, OpenFreeMap. meado is not affiliated with Plato Coffee. This is an independent study, made for fun.
Let’s talk over a Plato
Cafés, clinics or depots: we can show you where your next sites should go, weighted by whatever matters most to you. The coffee’s on us.
Talk to us